Understanding Probability of Detection and Time-to-Detection: The Continuous Monitoring Advantage
Overview
Probability of detection (PoD) is a commonly used metric in the emissions monitoring industry and is one way to characterize a sensor’s ability to detect emissions of different rates. For a lot of sensor technologies, it’s a sensible metric: if I point a sensor at a thing I’m trying to measure, how often does it work and how often does it fail?
But for continuous monitoring systems, the equation is a little different. The sensor is always on and always measuring. That is why, hidden in every probability of detection chart for continuous monitoring systems is a metric that is easy to miss - time. The time component means that PoD is really just another way to describe a Continuous Monitoring System’s Time-to-Detection (TtD). Let’s explore how this works.
Key Takeaways
Probability of Detection (PoD) is always based on a time period, which links PoD directly to Time-to-Detection (TtD).
PoD for an emission rises as time passes: eg. a measly 10% PoD in 15 minutes will reach 90% within 6 hours.
Where survey methods get one chance per flight or visit, continuous monitoring gets many attempts 24/7, making PoD less impactful.
Practically, emissions below the 90% PoD threshold will still be found given more time.
Emissions above the 90% threshold are mostly likely to be detected in the minimum time window, allowing you to act quickly when it matters.
What Is Probability of Detection?
Probability of detection is determined by exposing a sensor to a number of controlled releases, such as those done in a METEC-style campaign. Each known release is compared against the sensor’s output, which is either scored as a true positive or a false negative. Logistic regression is then applied to these hits and misses, reducing them to zeros and ones, and that produces the probability of detection chart.

Figure 1. An example probability of detection (PoD) curve.
The chart is the familiar S-curve that rises toward 100 percent and crosses the 90 percent line at some emission rate. That 90 percent probability of detection is the common metric used to grade monitoring systems.
How Does Time Figure Into This?
At METEC, the average release lasts about ten minutes. To normalize results, probability of detection curves are given a time component. In practice this means dividing data into time segments (say 15 minutes) and checking within each segment whether the system correctly predicted that an emission was occurring.
This time component is what links probability of detection to time to detection. For instance, if a system has a 90 percent probability of detecting an emission within 15 minutes, that probability of detecting that same emission increases with time. In 30 minutes it will reach 99 percent, in 45 minutes 99.9 percent, in an hour 99.99 percent, and so on.
To understand how this scaling works: imagine flipping a coin. The probability of getting heads is 50%. Flip the coin a second time, and the probability of getting heads at least once is 3 out of 4 permutations (heads/head, head/tails, tails/heads vs. tails/tails): 75%. Now imagine flipping a coin once every 15 minutes. The chance of missing once may be significant, but repeated attempts drive the probability of success toward certainty. For continuous monitoring, probability of detecting a long duration emission will always climb to nearly 100 percent given enough time.
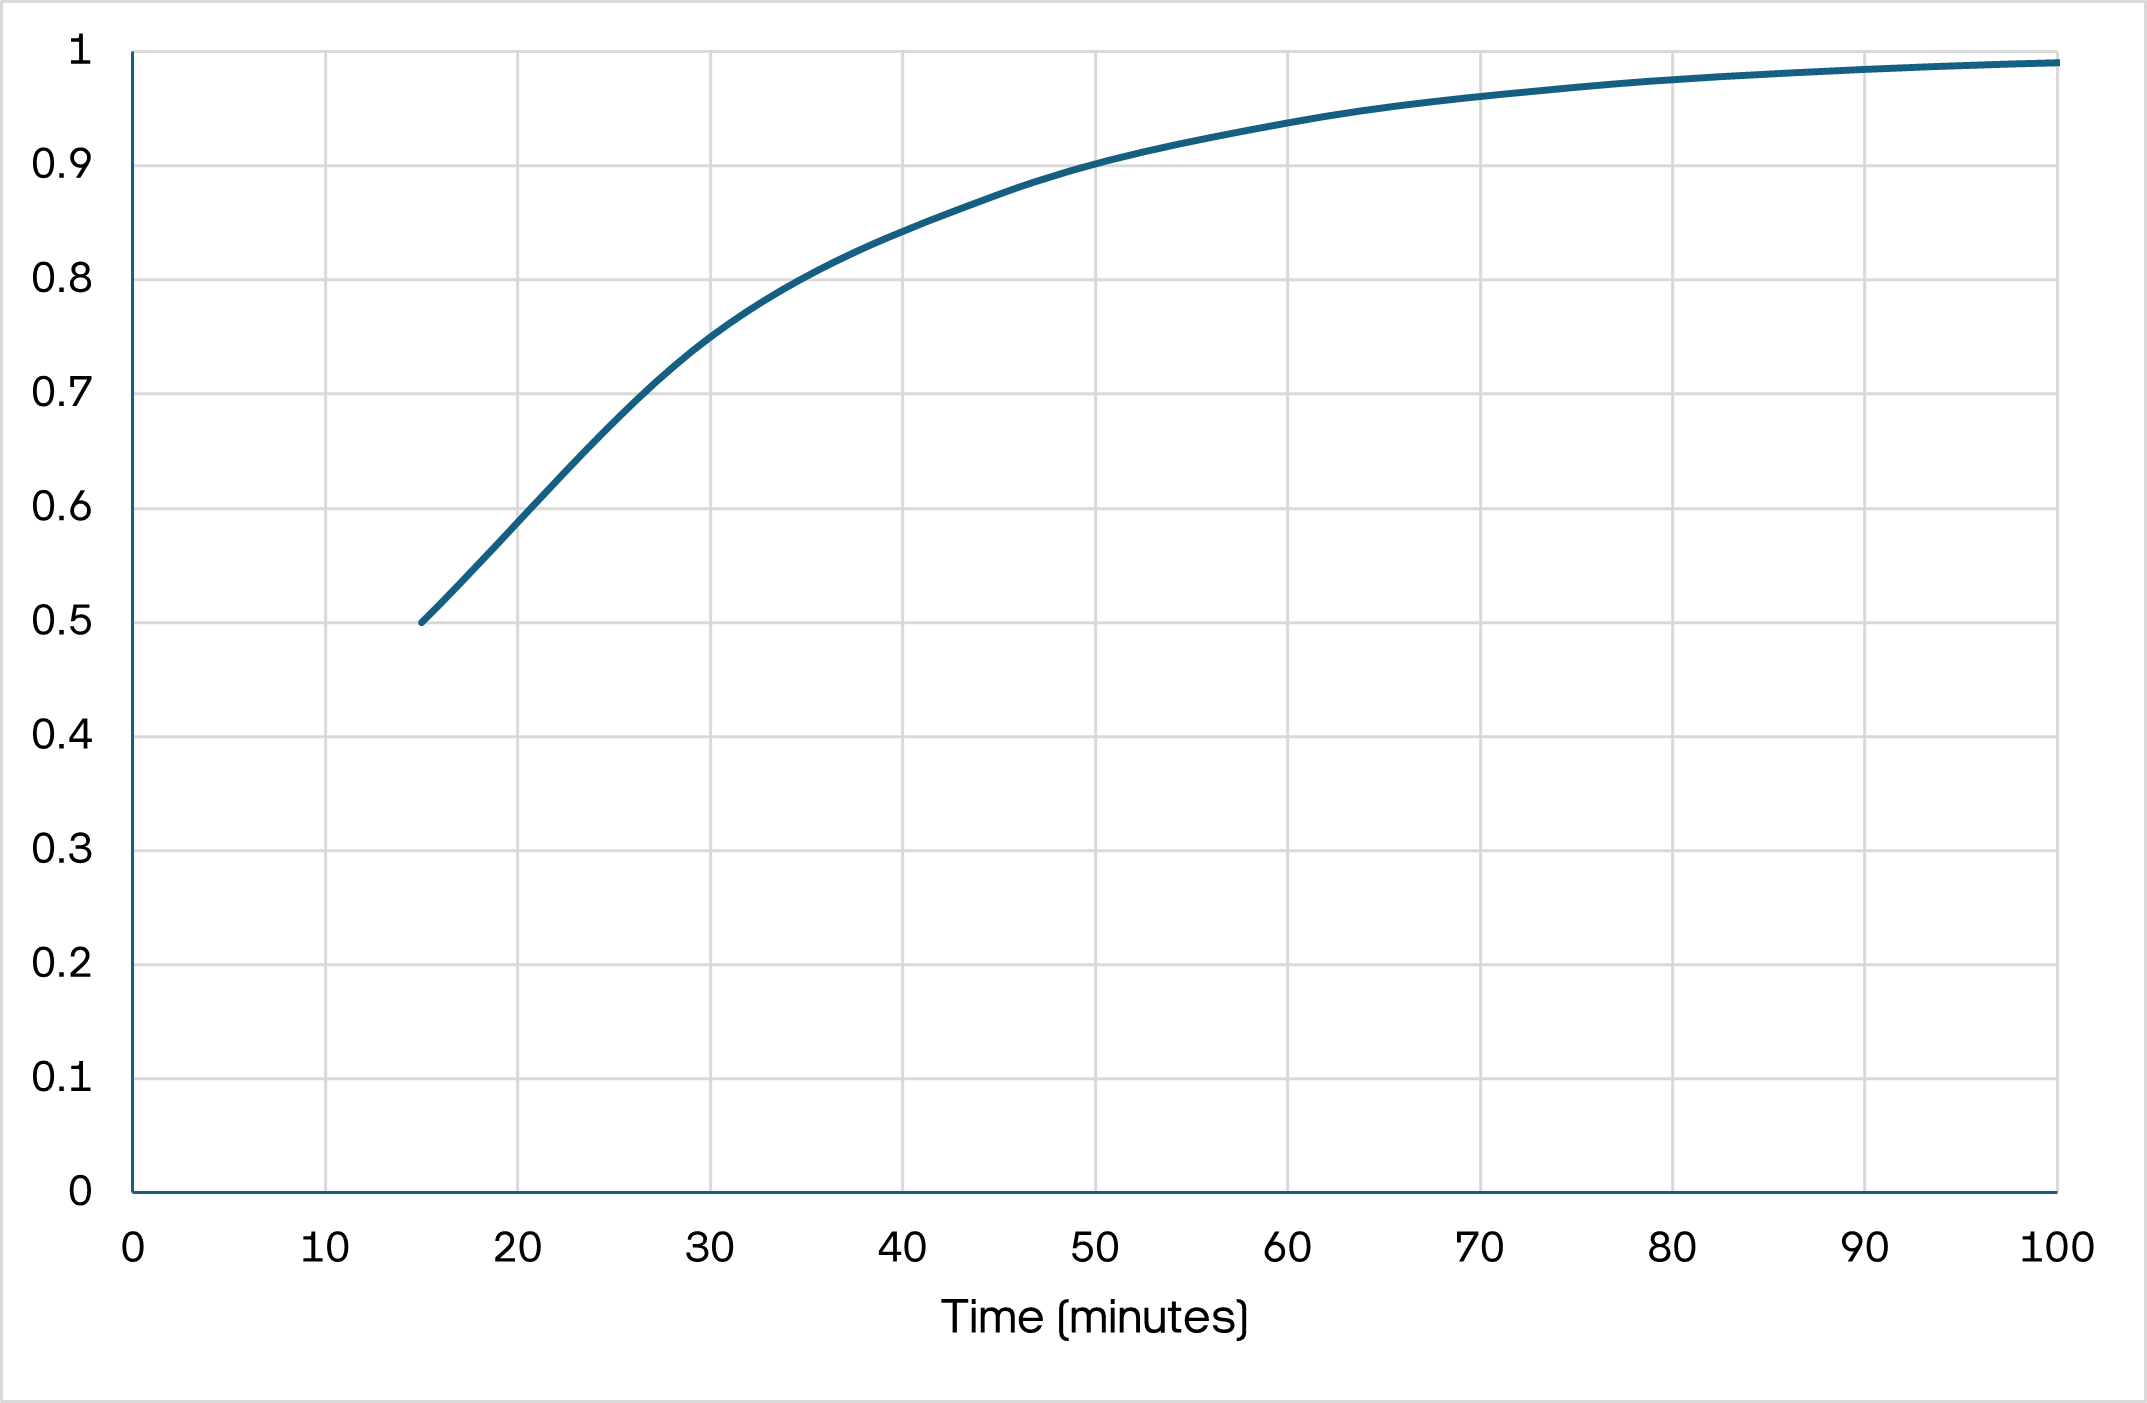
Figure 2. Probability of detection, given 50% measurement PoD.
Comparison to Survey Technologies
Survey-based technologies are different. The probability of detection metric is extremely important, since you only get one chance to detect an emission during a survey. A 90% PoD is the standard metric we discuss, but missing one in ten attempts is significant when your cadence is once a month or even once a week. By analogy, if a camera silently failed one out of every ten times you tried to take a photo, it would be a bad camera. With continuous monitoring, however, a 90 percent probability of detection is like missing one out of every ten frames in a movie. At 24 frames per second you may not even notice losing a few frames.
Time to Detection
So when comparing technologies it’s important to consider time. For continuous monitoring systems, if you don’t like the probability of detection, just wait longer. Even a weak continuous monitoring system with a probability of detection of 10 percent in a 15-minute window can, when extended over a few hours, achieve a near-certain probability of detection, especially if we are comparing to the time scales relevant to survey-based methods.
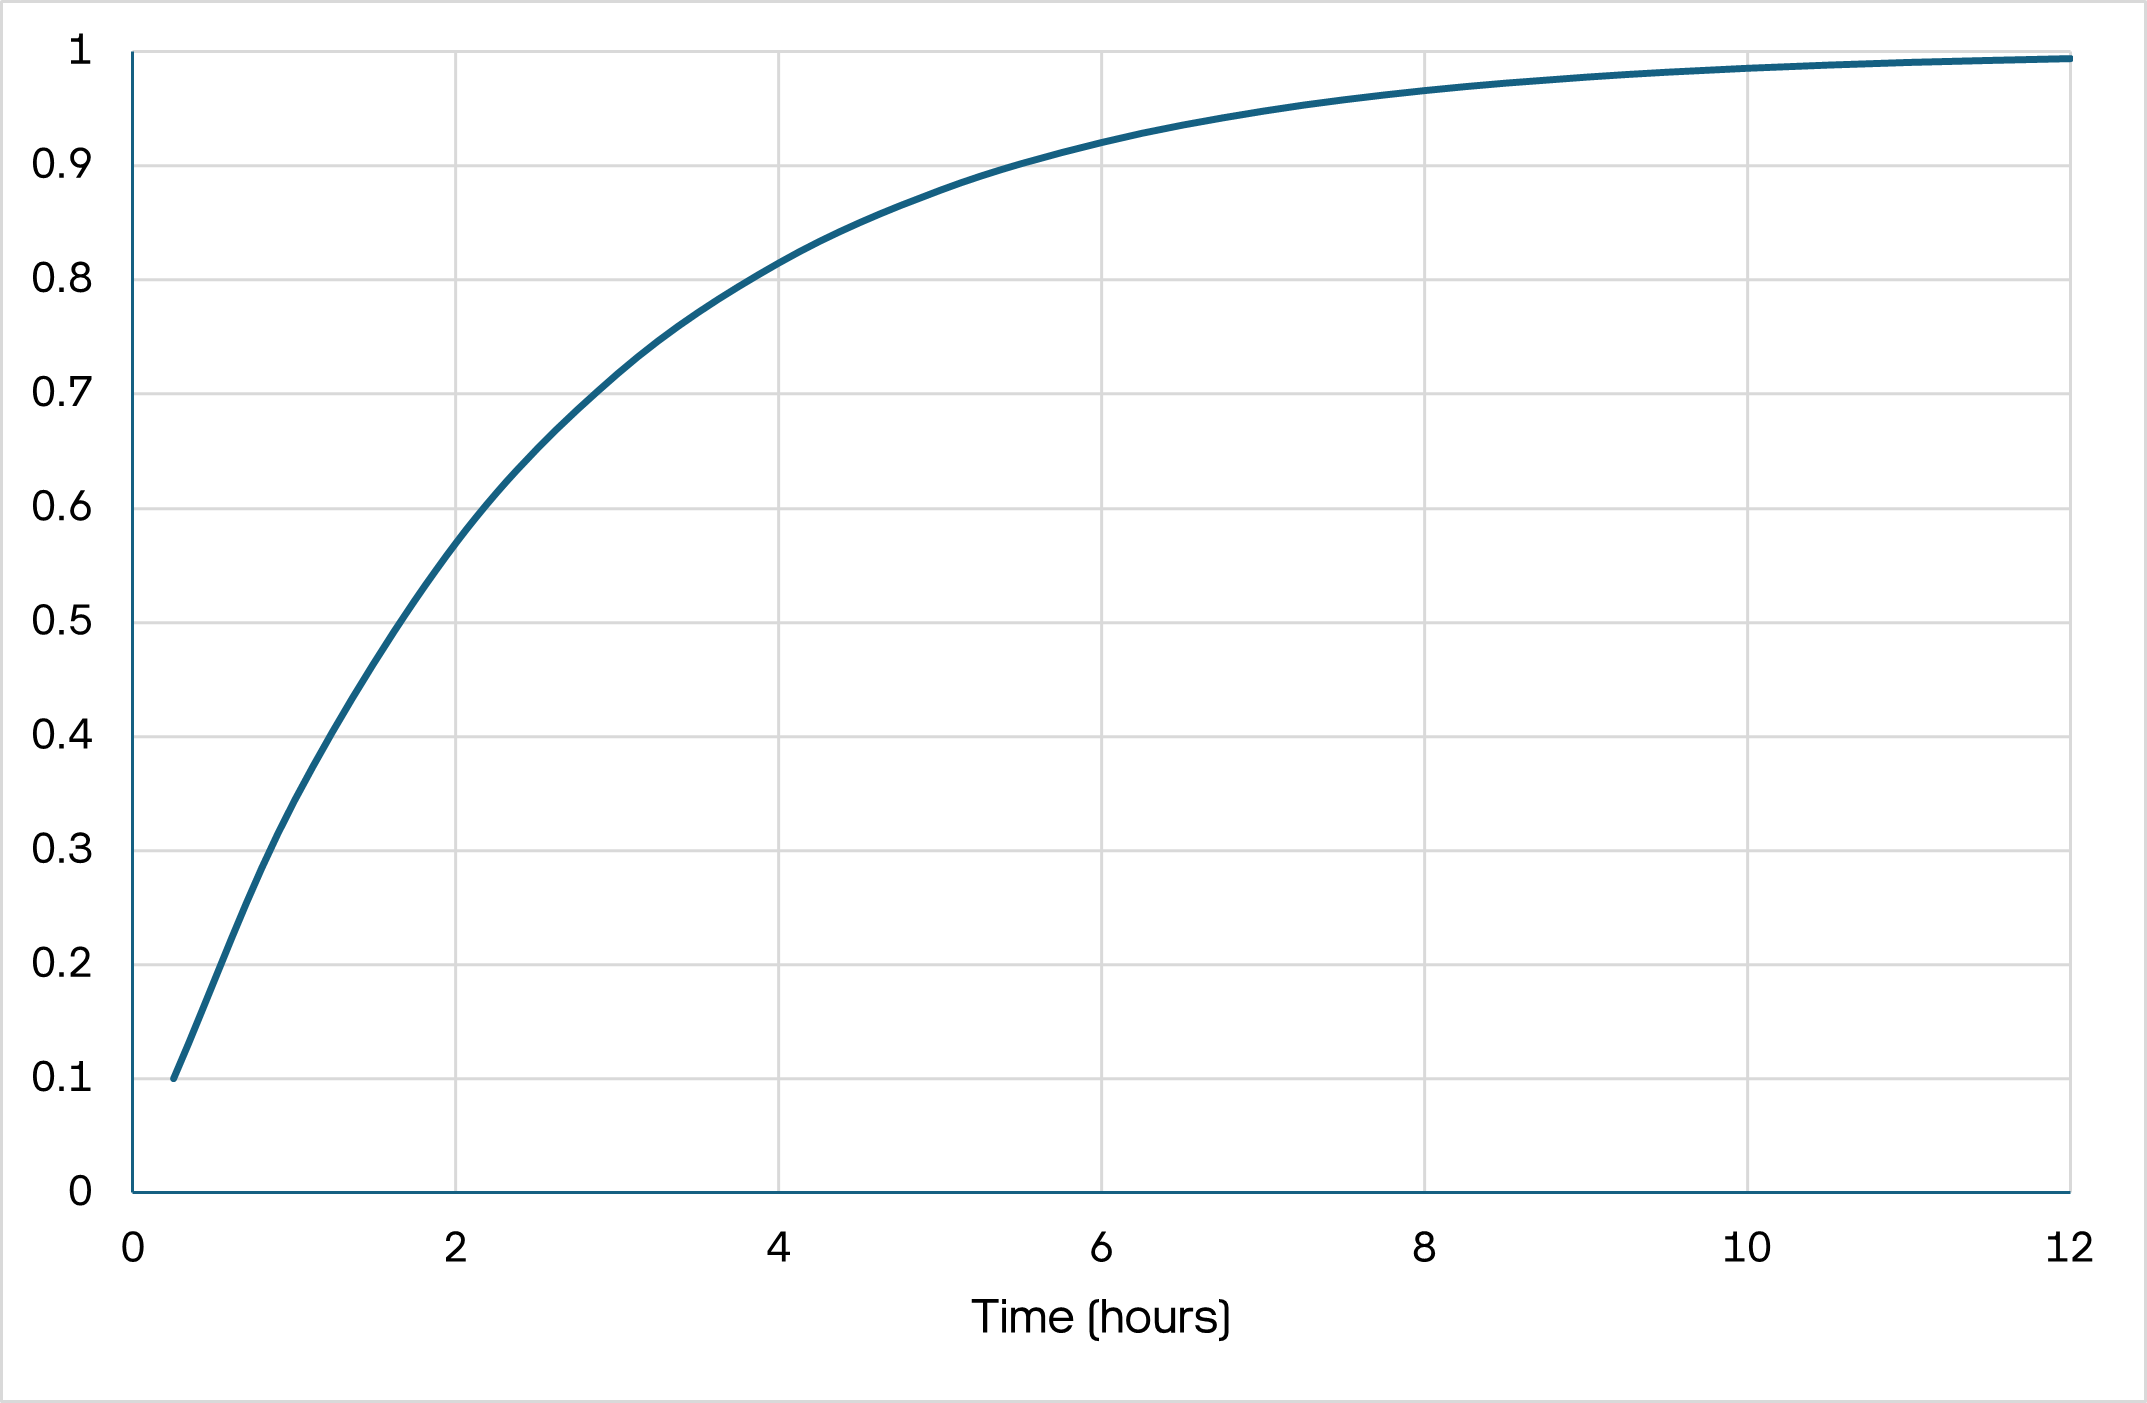
Figure 3. Probability of detection, given 10% measurement PoD.
In practice, this means that emission rates smaller than the 90% PoD will still be detected eventually, they may just have a longer time-to-detection. This also means that emission rates above the 90% PoD threshold will most likely be detected within the minimum timespan possible. This is an important distinction, since rates above the 90% PoD threshold are leaks that are most important to respond to quickly, and to quantify accurately.
In short, PoD scales with time. A system that detects 90 percent of emissions of a certain rate within 15 minutes will detect closer to 99 percent within 45 minutes. Time to detection is simply the statistical representation of how quickly you can be confident a continuous monitoring system will identify an emission.